Logo

Help and FAQs

Browser requirements
iPath user interface requires the Adobe Flash plugin, version 10 or later. Any browser which supports Flash should work OK. Go to Adobe's page to download and install the latest Flash plugin for your browser.
We tested the following:

Certain features of iPath (restoring selections and access to previously exported files) require access to Flash shared storage ('Flash cookies').

User interface

Overview

Main parts of iPath's user interface are shown in the image on the right.

  1. Main map display displays the currently selected map. Navigate the map using the Pan/zoom controls, described below (3).
  2. Use Map selection tabs to switch between various pathways maps loaded into iPath.
  3. Pan and zoom controls. Use the arrows to pan and plus/minus icons to zoom. You can also change the zoom level using the slider below the icons, or by using your mouse wheel. Clicking the 'fit' icon (marked with 'b' in the image) will fit the map into current window. Use the 'hand' icon to toggle drag-to-pan function. When enabled, you can click and drag the map around.
  4. Function buttons. Use these buttons to access the map customization and export panels (described in detail in the following sections).
  5. Element information box provides the detailed information on selected map nodes or edges. Elements can be selected by simple clicking.

iPath2 user interface (click to enlarge)
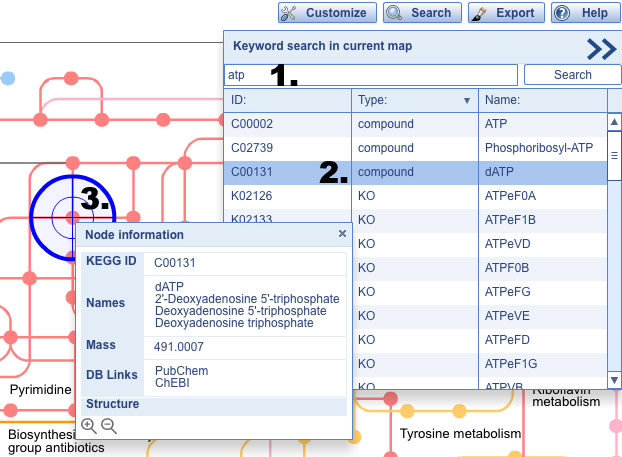
Search

Clicking the Search function button will reveal the keyword search panel.
  1. Type your query into the box, and press Enter or click the Search button. Data associated with all elements of the currently selected map will be searched.
  2. Clicking on a row in the results list will display all its occurences in the map (in the shape of blue crosshairs).
  3. Clicking on any crosshair in the map will display the popup info window for the matched node or edge.

Identifiers and names of following data types will be searched:

  • Compounds
  • Pathways
  • Orthologous groups
  • Modules
  • Enzymes
  • Reactions

Keyword search (click to enlarge)
Map customization

Basics

iPath2 provides powerful data mapping tools and extensive customization options. Clicking the 'Customization' button will open a panel (shown on the right) which provides access to all available customization options. Hover your mouse cursor over individual options to show a short explanation in a popup balloon. Various options are described in detail below:
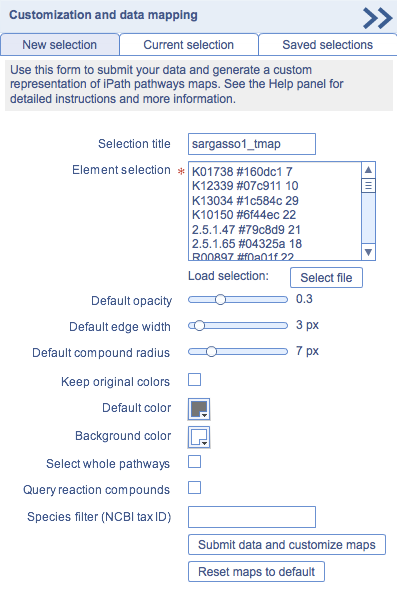
  • Element selection: Use this box to define customization parameters for various elements of the map. Each node and edge in the maps has various types of data associated with it (see the list below for supported data types). Each line of your element selection must start with an ID, followed by one or more customization parameters. All elements in the maps which are associated with the specified ID will be customized according to your parameters.

    Three parameter types are suppored:

    1. Color: can be specified in hexadecimal, RGB or CMYK notation (for example: #ff0000, RGB(255,0,0) or CMYK(0,100,100,0) )
    2. Width: prefix W followed by a number; used as line width for edges or radius for nodes
    3. Opacity: a number between 0 (fully transparent) and 1 (fully opaque)

    For example:

    C00001 #0000ff W20 0.5
    K00824 #00ff00
    R09112 #ff0000 W10
    

    In the example above, all map elements which contain water (KEGG compound ID C00001) will be colored blue (#0000ff), half transparent (opacity 0.5) and have width/radius 20px (W20). Elements which are associated with KEGG orthoulogous group K00824 will be colored green (#00ff00), fully opaque and use the default width. Elements which are associated with KEGG reaction R09112 will be colored red (#ff0000), fully opaque and have width/radius 10px (W10).

  • Selection title: If you provide a title when submitting an element selection, all parameters will be stored on the server. Visit the 'Saved selections' tab to easily restore your previously saved selections.
  • Default opacity: A value beween 0 (fully transparent) and 1 (opaque), which is used for all elements of the map which DO NOT match any of your selection IDs.
  • Default edge width: A value between 1 and 30 (in pixels); will be used for all edges which do not match your selection, or do not have a width parameter specified in the selection.
  • Default node radius: A value between 1 and 30 (in pixels); will be used for all nodes which do not match your selection, or do not have a width parameter specified in the selection.
  • Keep original colors: when this box is checked, all elements in the map will keep their original color, except those changed by your selection
  • Default color: this color will be used for non-selected parts of the map, when 'Keep original colors' box is not checked
  • Background color: background color for all maps
  • Select whole pathways: when this box is checked, any selection matching a single edge or node within a pathway will highlight the whole pathway in the maps
  • Query reaction compounds: when using KEGG compound IDs in your selection, checking this box will make iPath check for presence of those compounds within all reactions associated with map's edges. Matching edges will be highlighted using the parameters specified for the compound in your selection.
  • Species filter: specify a NCBI taxonomy ID or KEGG 3 letter species code in this box to display only map elements which are present in that particular organism. Rest of the map will be displayed in gray. Clicking the 'Select' button next to the input box will open a panel where you can search for a species by name. Clicking on a name in the results list will automatically fill the correct NCBI taxonomy ID into the input box.

Customization panel

Supported data types

The following data types are supported by iPath, and can be used to customize the maps. Make sure you use the required prefix for each data type, as shown in the examples below.

Data typePrefixExample ID
KEGG Pathways-00650
KEGG Compounds-C00003
KEGG KOs-K01000
STRING proteins-224324.AQ_626
KEGG proteins-aae:aq_626
COGs/eggNOGG OGs-COG0007
Enzyme EC numbersE or ECE2.4.1.82
Uniprot IDs/ACCsUNIPROT:UNIPROT:Q93015
IPI IDs-IPI00745889
NCBI GI IDsncbi-gi:ncbi-gi:326314893

Current selection's map matching statistics

"Current selection" tab in the "Customization and data mapping" panel will give you an overview of how your current element selection matched the maps. The tab is divided into 3 sections:
  1. Match statistics: shows the total number of edges and nodes in different maps which were matched by each submitted ID
  2. ID's without matches: is a list of all IDs from your selection which did not match any element in the maps
  3. Conflicts: When multiple IDs with different parameters in your selection match the same element in the map, a conflict occurs. Only one set of parameters will be used (a random one). This table will list all conflicting IDs and show the type of conflict (color, width or opacity)

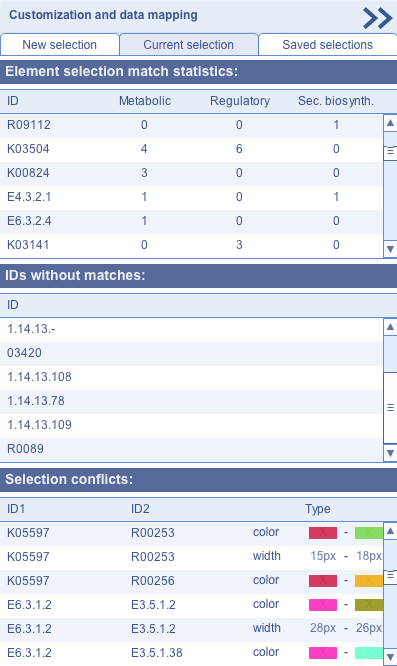
Current element selection matching statistics (click to enlarge)

Saving and restoring element selections

If a Selection title is specified when submitting data, all selection parameters will be stored on the server, and can be simply accessed through the "Saved selections" tab. Use the icons next to each saved selection name to either restore the selection, or delete it.

Example dataset

An example dataset file is available for download, which maps the enzymatic activity in the human gut microbiome (metagenomic data derived from Japanese fecal samples). First, second and third columns represent 1:ortholog ID in KEGG, 2:abundance of the OG (represented using element width, 'W') and 3:color in the map respectively. Simply paste the contents of the file into iPath's element selection box, and set map background color to black for best results.

Exporting maps
Customized maps in iPath can be saved in various output formats. Clicking the 'Export' button will open the export panel, shown on the right. Maps can be exported into any of the following formats:
  • Portable Network Graphics (png)
  • Encapsulated Postscript (eps)
  • Postscript (ps)
  • Portable Document Format (pdf)
  • Scalable Vector Graphics (svg)
If you plan to include your map in a publication, we recommend exporting to a 300 DPI PNG image. For further editing of the maps, use either SVG or EPS and a vector based editing software (like Inkscape or Adobe Illustrator). Adobe Illustrator often has problems with SVG, so we recommend EPS when using Illustrator. For best results and greatest amount of control, we recommend exporting to SVG and using Inkscape to edit and convert the file.

Note: Due to technical limitations, transparency cannot be preserved in EPS and PDF formats.

If you provide an optional export title, your exported map will be stored on the server for 30 days, and accessible through the 'Saved exports' tab.
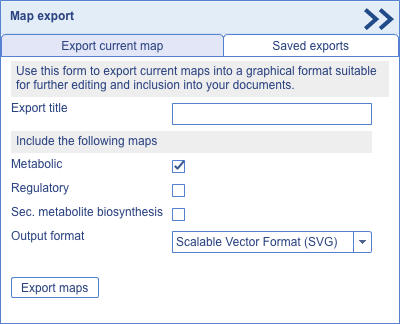

Map export panel
FAQ
This section is still empty... If you have a question or comment, please contact us.